Instructions
Use the RCV Tabulator to run a ranked choice election to determine the winner, understand round-by-round vote counts, and visualize the vote flow in a Sankey diagram.
Set Up
To get started, use a Google Form to run your election. For each ranked-choice race, create a question using the following settings.
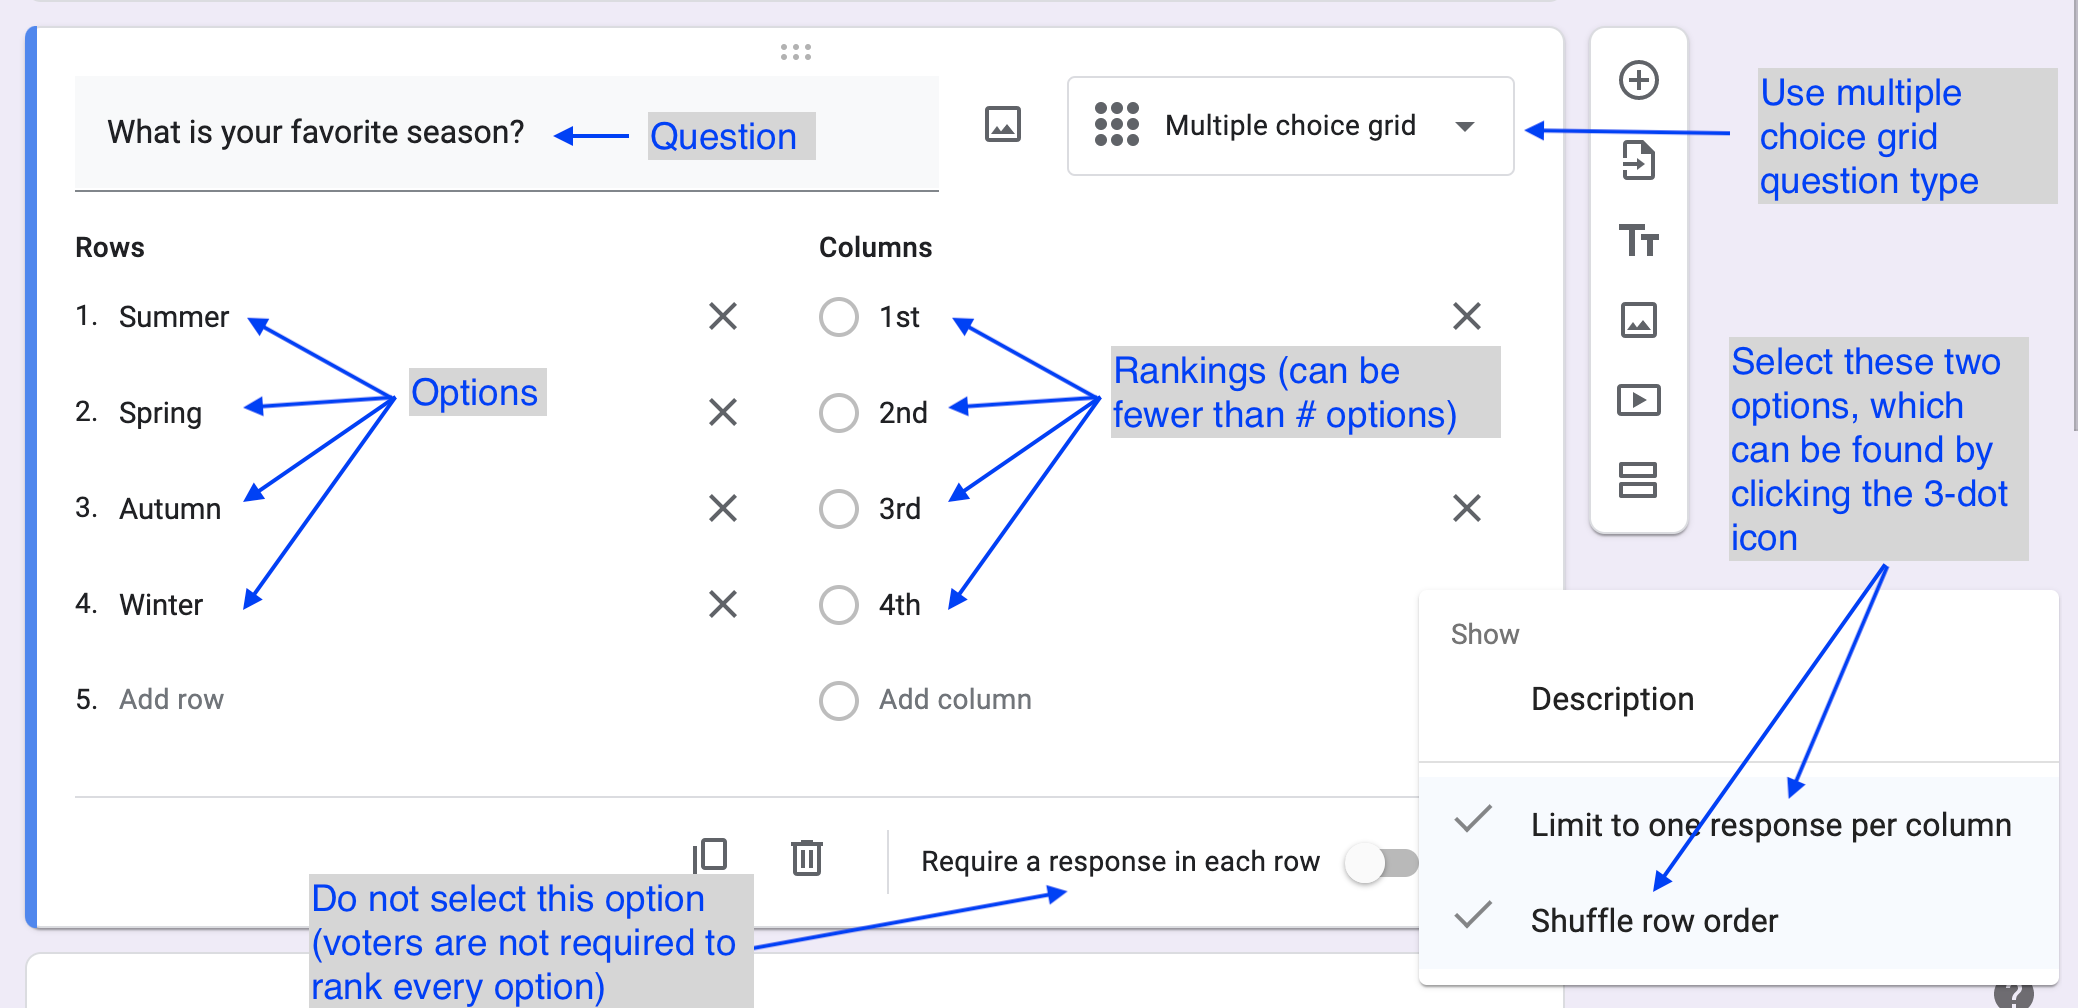
- Select the "Multiple Choice Grid" question type
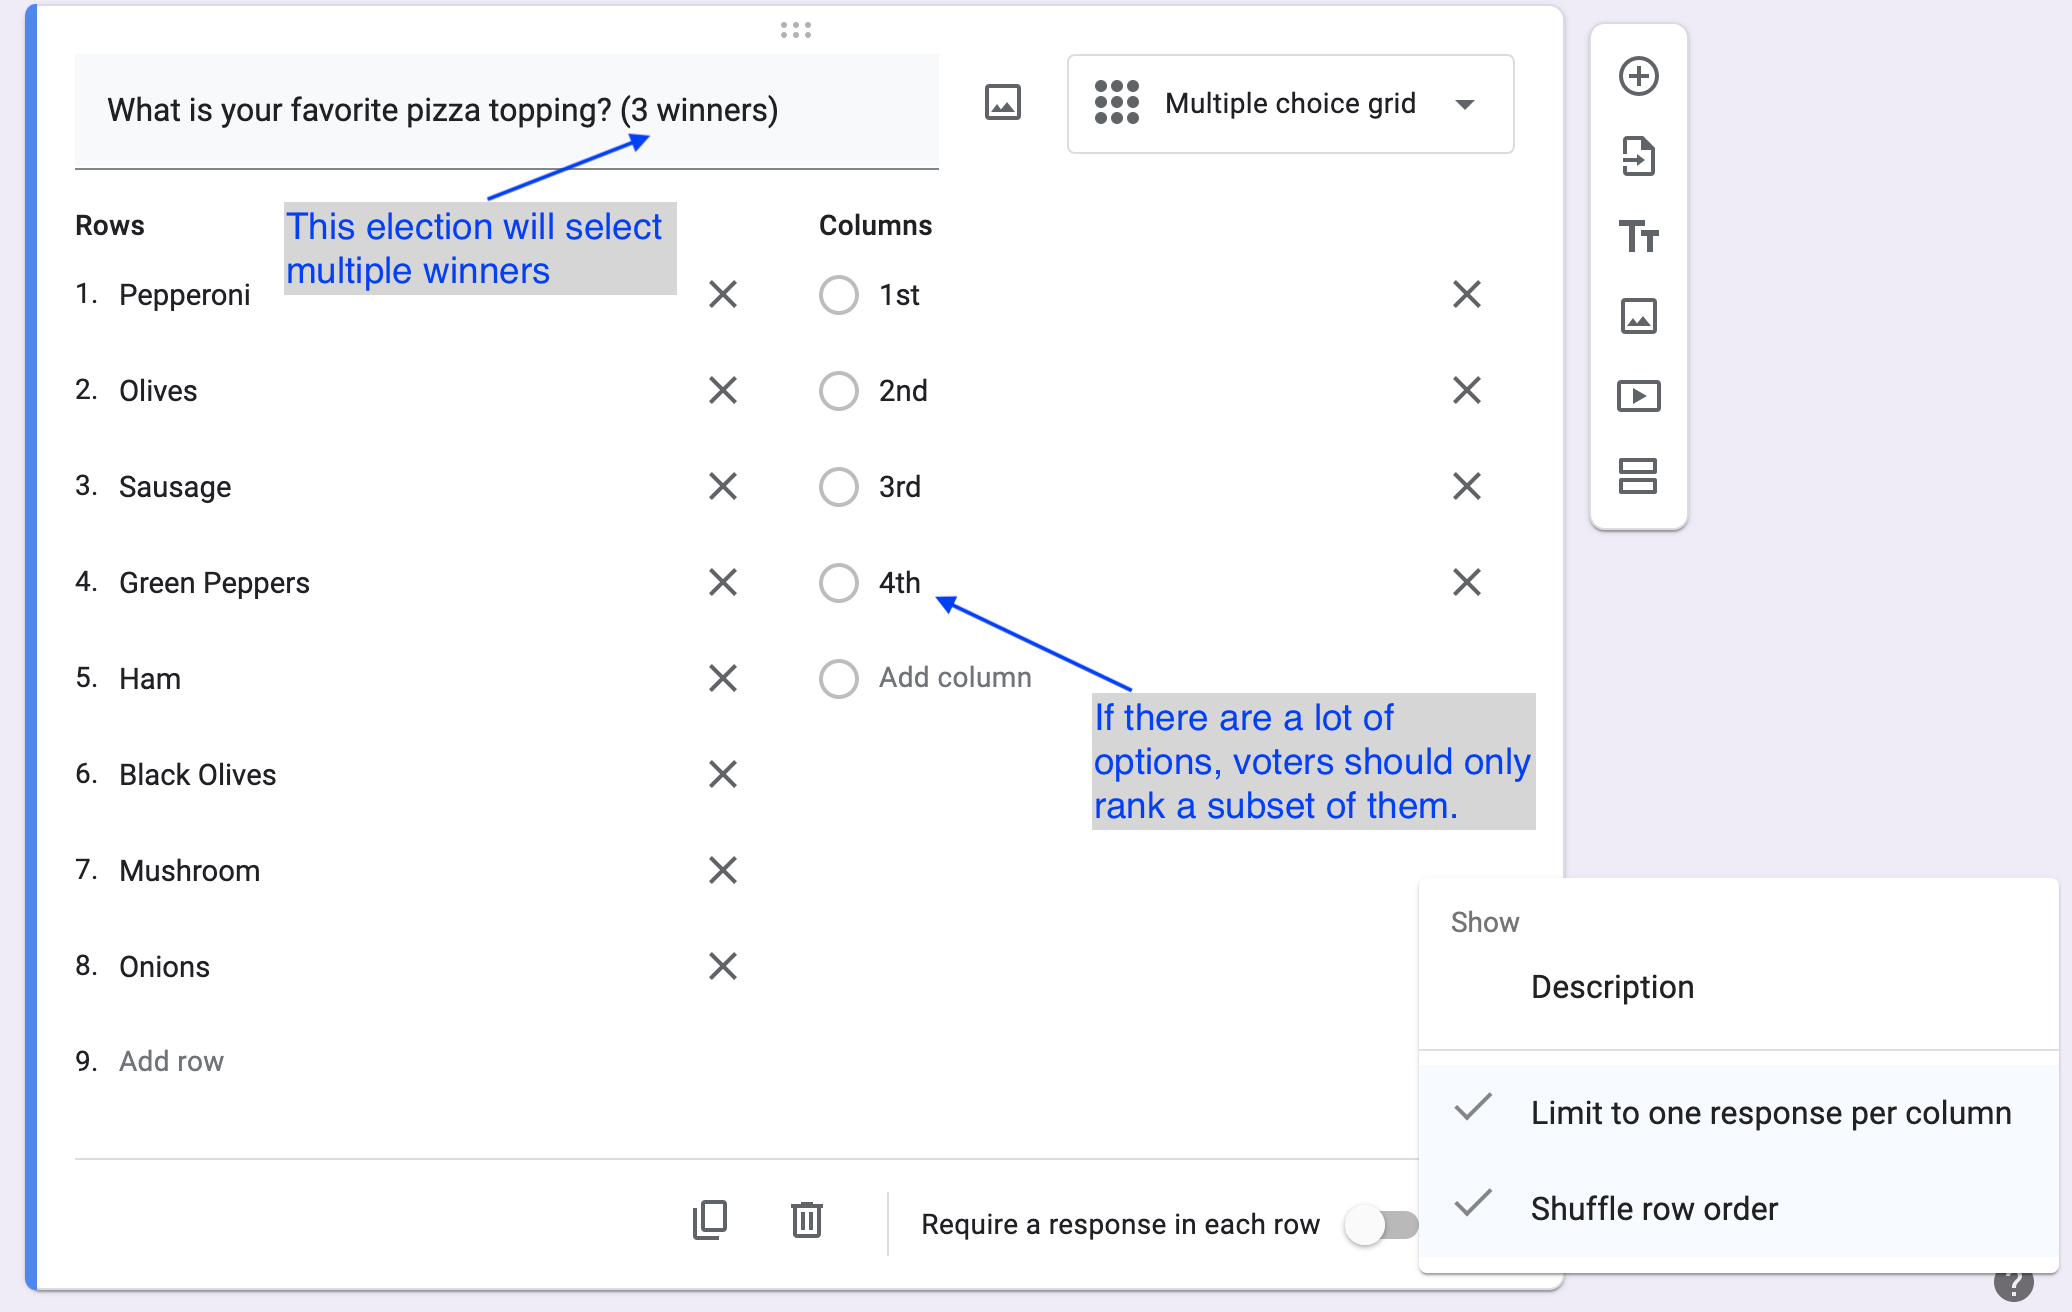
- Enter the race or question in the "Question" space. If your contest has multiple winners, append the string "(x winners)", replacing x with the number of winners.
- Label the rows with each candidate's name
- Label the columns "1st", "2nd", "3rd", ... [up to the number of rankings you allow]
- Turn on the "Limit one response per column" setting.
- Do NOT use the "Require a response in each row" setting, unless it is something you *really* want. In most cases, it is acceptable to allow voters not to rank all candidates. It is also acceptable to skip rankings, as the tabulation process only cares about overall order (i.e. ranking 3 candidates as 2,4,5 is the same as ranking them 1,2,3.)
- It is recommended to use the "Shuffle row order" to remove any bias toward candidates listed near the start of the order.
The following image demonstrates the basic setup of a single-winner election, highlighting all the settings described above.
The next image shows the wording change needed in a question for a multi-winner election. Additionally, it demonstrates that you can limit the number of rankings required when there are many options (which can happen in both single- and multi-winner elections).
Tablulation
Once voting is complete for your entire election:
- Go to the "Responses" tab of your form.
- Within the 3-dot menu in the responses section (not the one at the top of the page) and select "Download responses (csv)"
- Unzip the file
- Upload the unzipped file to RCV tabulator main page for analysis.
Example Data
If you'd like to examine some example data and try out the site, there is some example results from a mock election with:
- An poll for the top three pizza toppings, where each voter can rank up to four toppings on their ballot.
- A poll for the best season, where each voter can rank all four seasons, but only one season is the winner.